Skywalking tracing
The Skywalking tracing sandbox demonstrates Envoy’s request tracing capabilities using Skywalking as the tracing provider.
In this example, 2 backend services are provided:
service-1service-2
3 Envoy proxies are also provided to route requests to them:
envoy-front-proxy(envoy-front-proxy.yaml)envoy-1(envoy-1.yaml)envoy-2(envoy-2.yaml)
Of these services, only the Envoy front-proxy service is exposed outside of the
composition, on port 10000.
For service-1, requests are routed based on the request path trace/1, as follows:
User -> Envoy(
envoy-front-proxy) -> Envoy(envoy-1) ->service-1
For service-2, requests are routed based on the request path trace/2 as follows:
User -> Envoy(
envoy-front-proxy) -> Envoy(envoy-1) -> Envoy(envoy-2) ->service-2
All Envoy proxies are configured to collect request traces, as can be seen in their configurations, propagating the spans generated by the Skywalking tracer to a Skywalking OAP cluster.
Each span records the latency of upstream API calls as well as information needed to correlate the span with other related spans (e.g., the trace ID).
The Skywalking web UI for viewing the collected traces is available on port 8080.
Step 1: Build the sandbox
Change directory to examples/skywalking in the Envoy repository.
To build this sandbox example, and start the example services run the following commands:
$ pwd
envoy/examples/skywalking
$ docker-compose pull
$ docker-compose up --build -d
$ docker-compose ps
Name                           Command                  State                          Ports
---------------------------------------------------------------------------------------------------------------------------
skywalking_elasticsearch_1       /bin/tini -- /usr/local/bi ... Up (healthy)   9200/tcp, 9300/tcp
skywalking_envoy-1_1             /docker-entrypoint.sh /usr ... Up             10000/tcp
skywalking_envoy-2_1             /docker-entrypoint.sh /usr ... Up             10000/tcp
skywalking_envoy-front-proxy_1   /docker-entrypoint.sh /usr ... Up             0.0.0.0:10000->10000/tcp,:::10000->10000/tcp
skywalking_service-1_1           python3 /code/service.py       Up (healthy)
skywalking_service-2_1           python3 /code/service.py       Up (healthy)
skywalking_skywalking-oap_1      bash docker-entrypoint.sh      Up (healthy)   11800/tcp, 1234/tcp, 12800/tcp
skywalking_skywalking-ui_1       bash docker-entrypoint.sh      Up (healthy)   0.0.0.0:8080->8080/tcp,:::8080->8080/tcp
Step 2: Make a request to service-1
Now send a request to service-1, by calling http://localhost:10000/trace/1.
This will be routed via 2 of the Envoy proxies:
front-proxyenvoy-1
$ curl localhost:10000/trace/1
Hello from behind Envoy (service 1)!
Step 3: Make a request to service-2
Now send a request to service-2, by calling http://localhost:10000/trace/2.
This will be routed via all 3 of the Envoy proxies:
front-proxyenvoy-1envoy-2
$ curl localhost:10000/trace/2
Hello from behind Envoy (service 2)!
Step 4: View the traces in Skywalking UI
Point your browser to http://localhost:8080.
You should see the Skywalking dashboard.
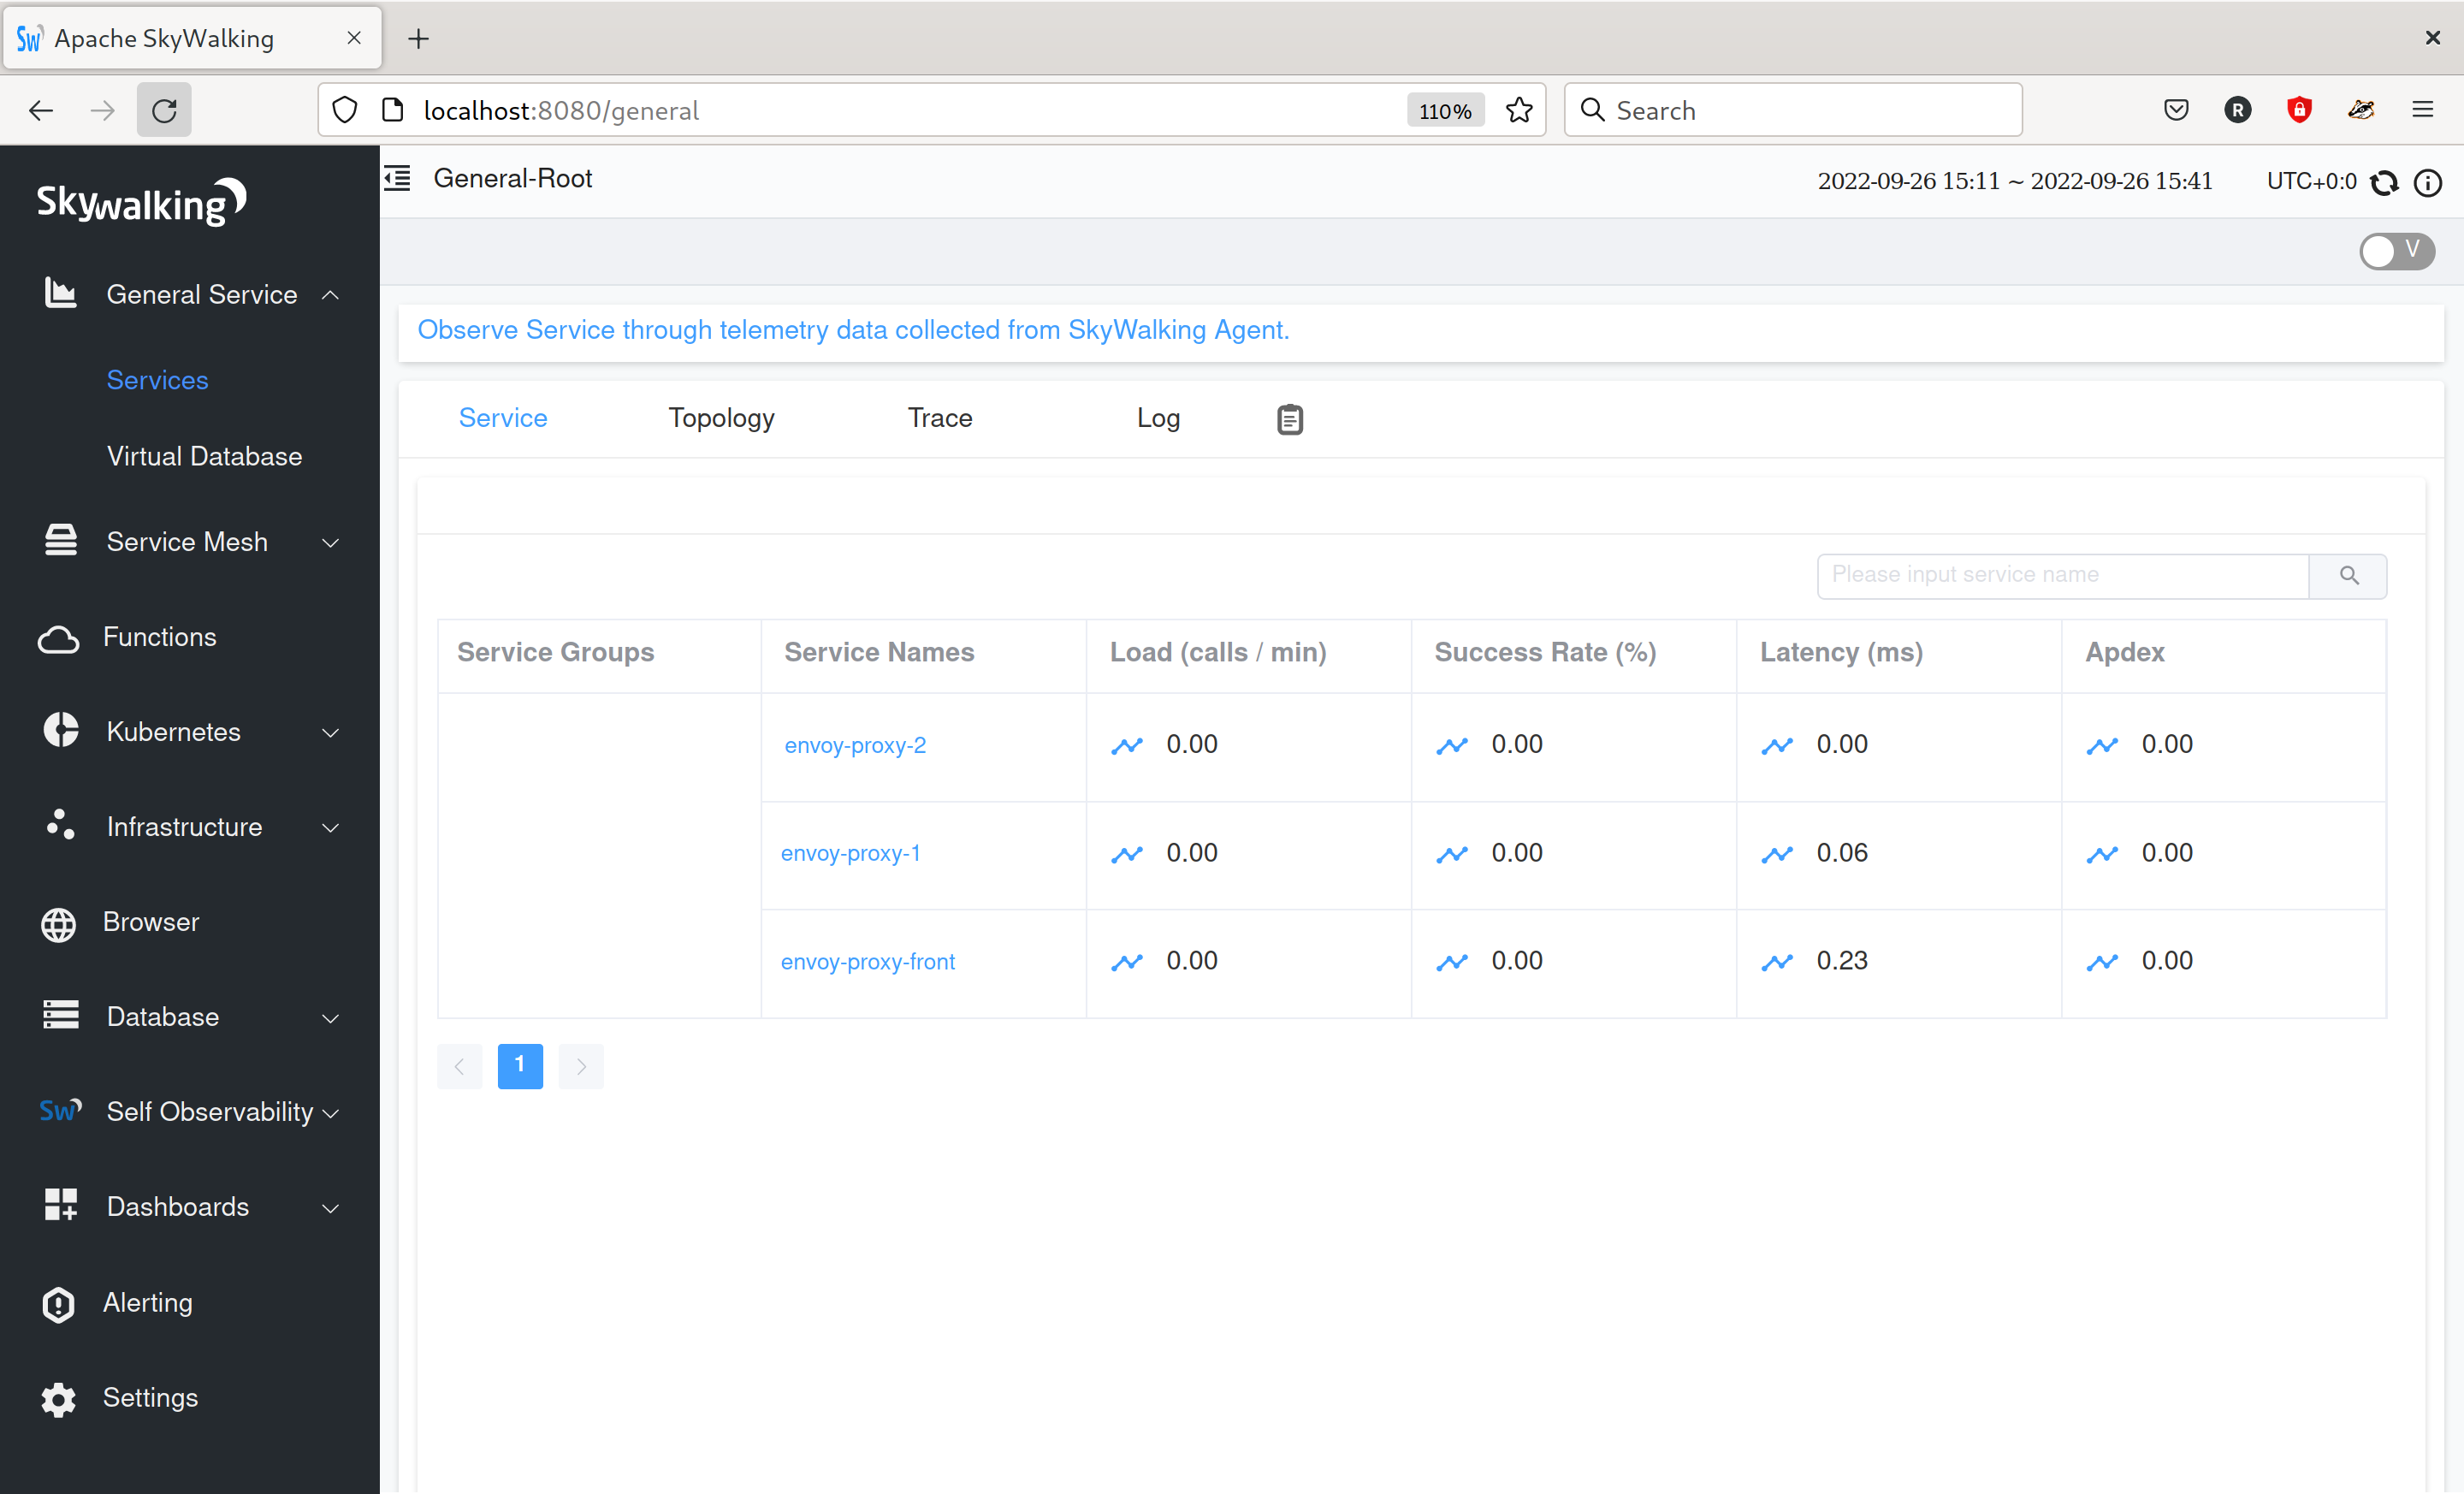
You may need to wait a moment for the traces to be added, but clicking on General Service > Services, you
should see the Envoy services listed.
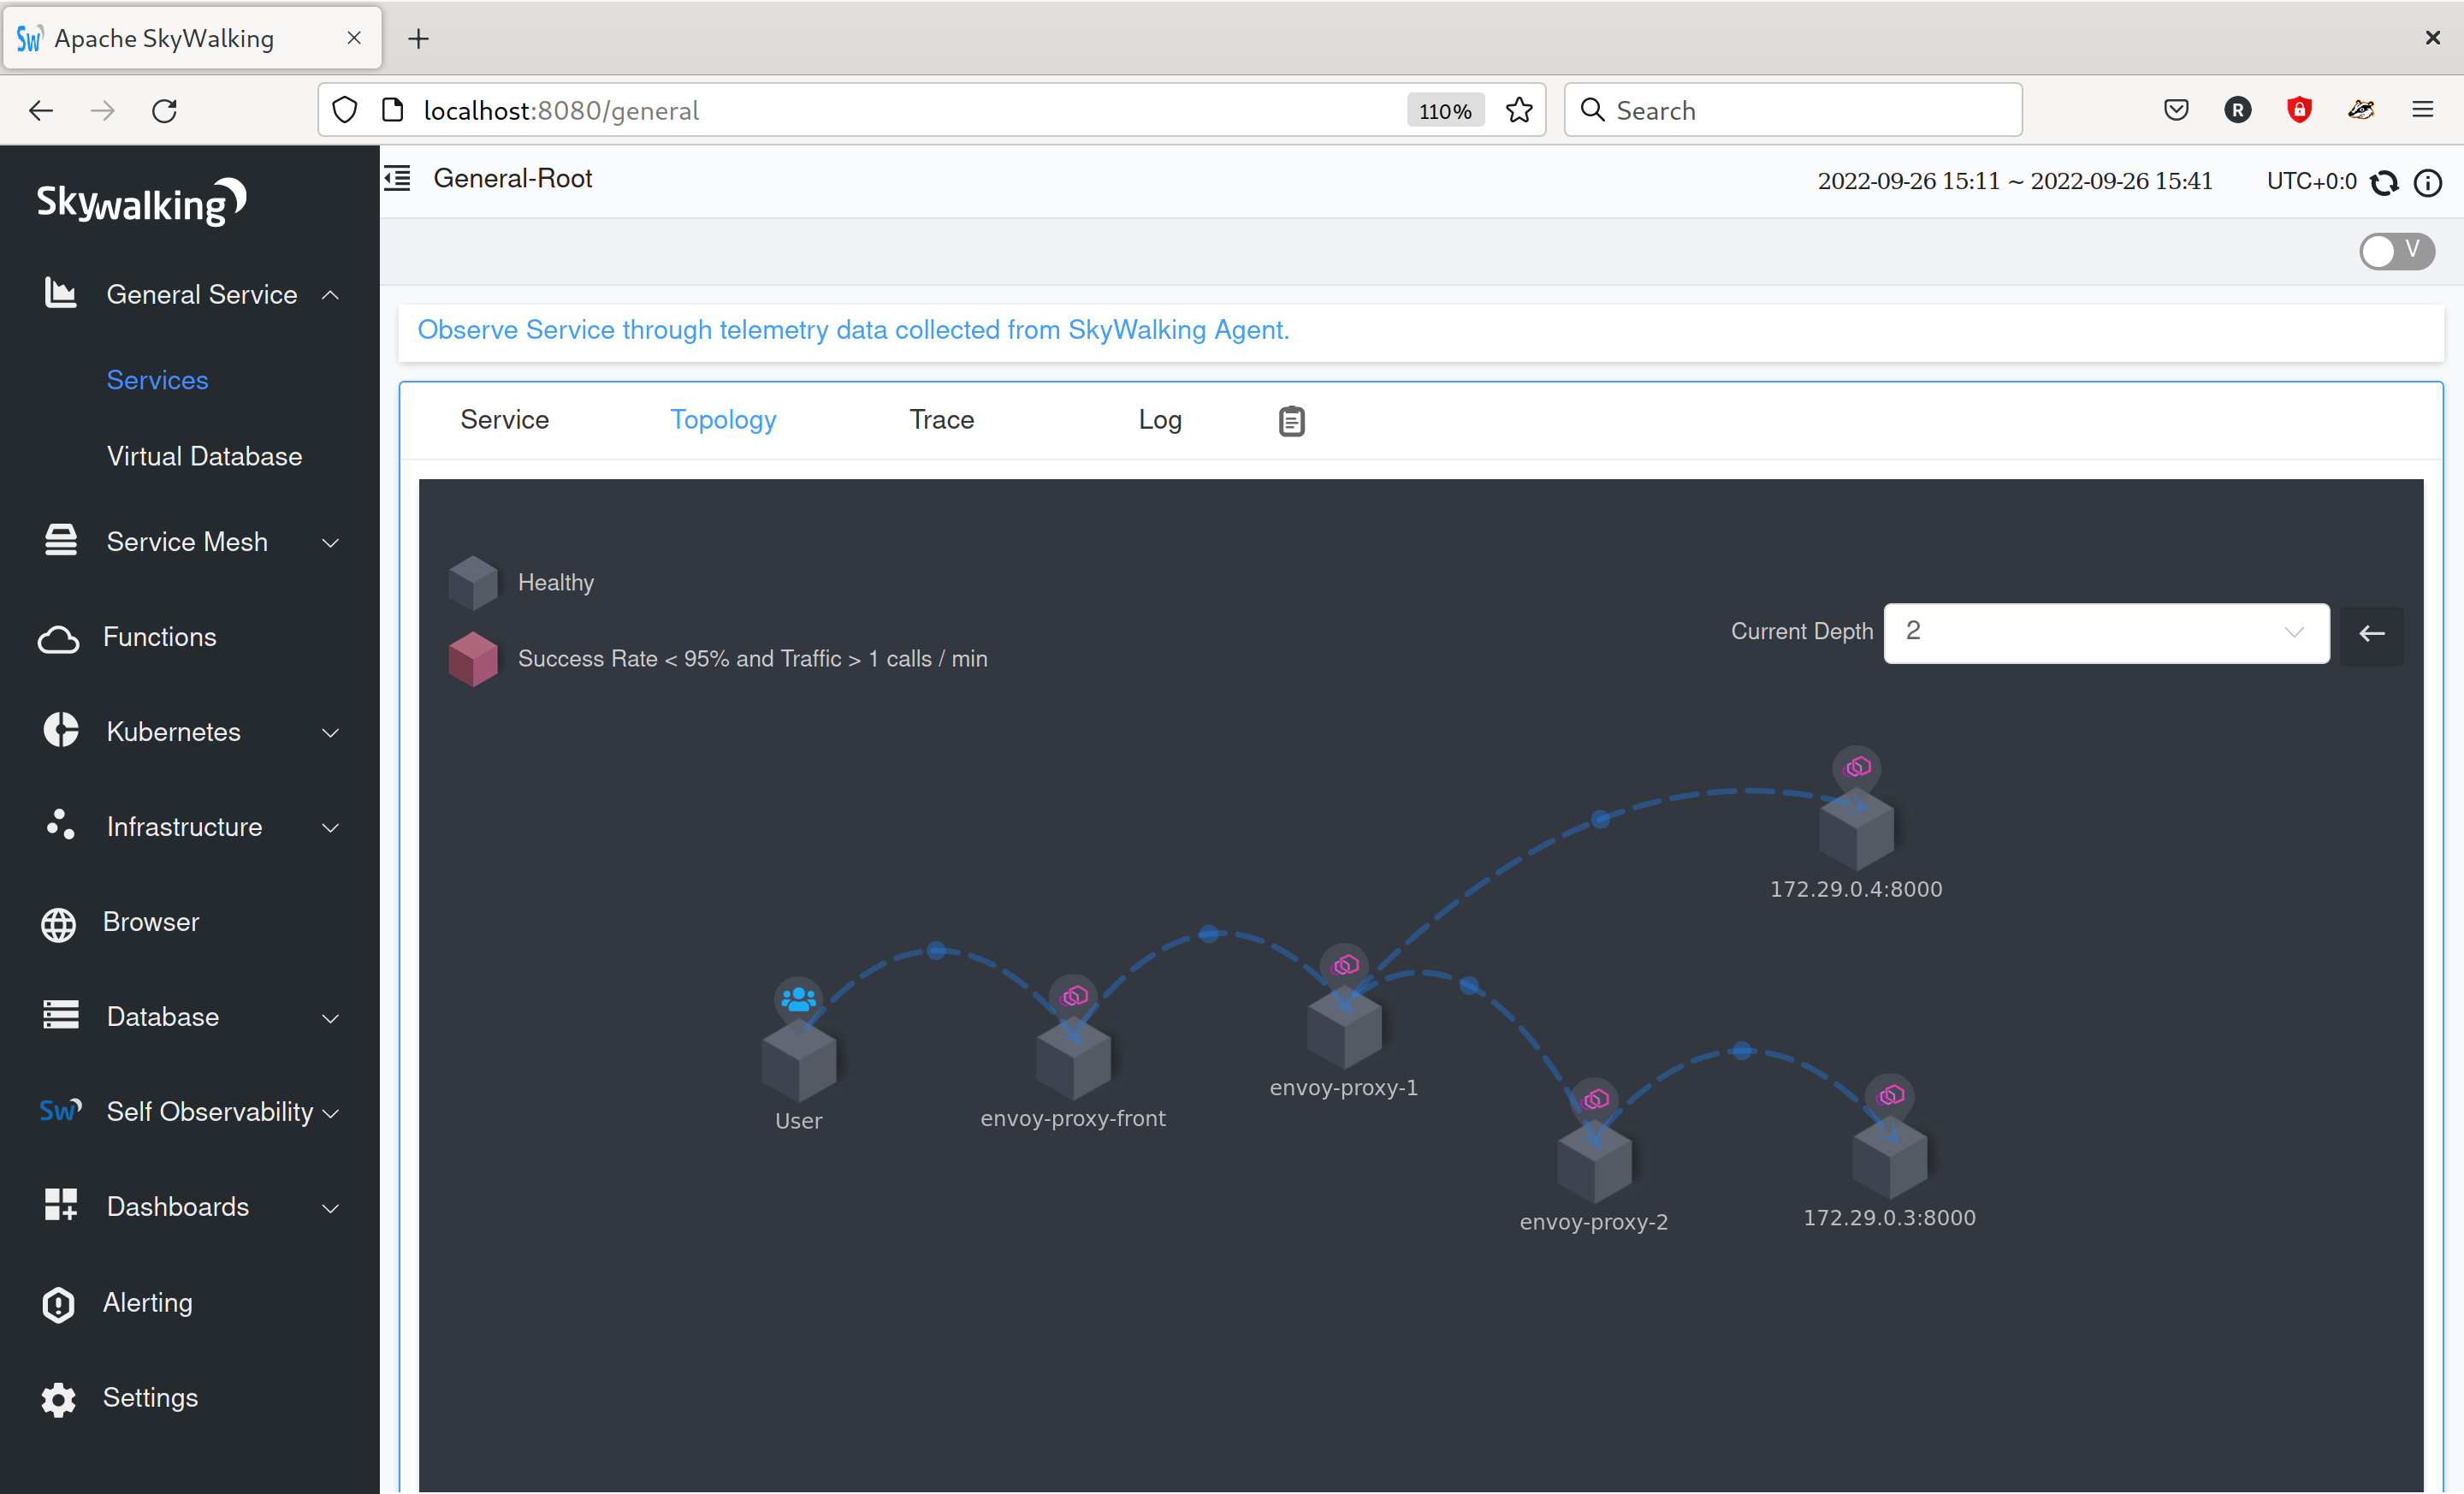
From here you can explore the metrics and views that skywalking offers, such as the Topology:
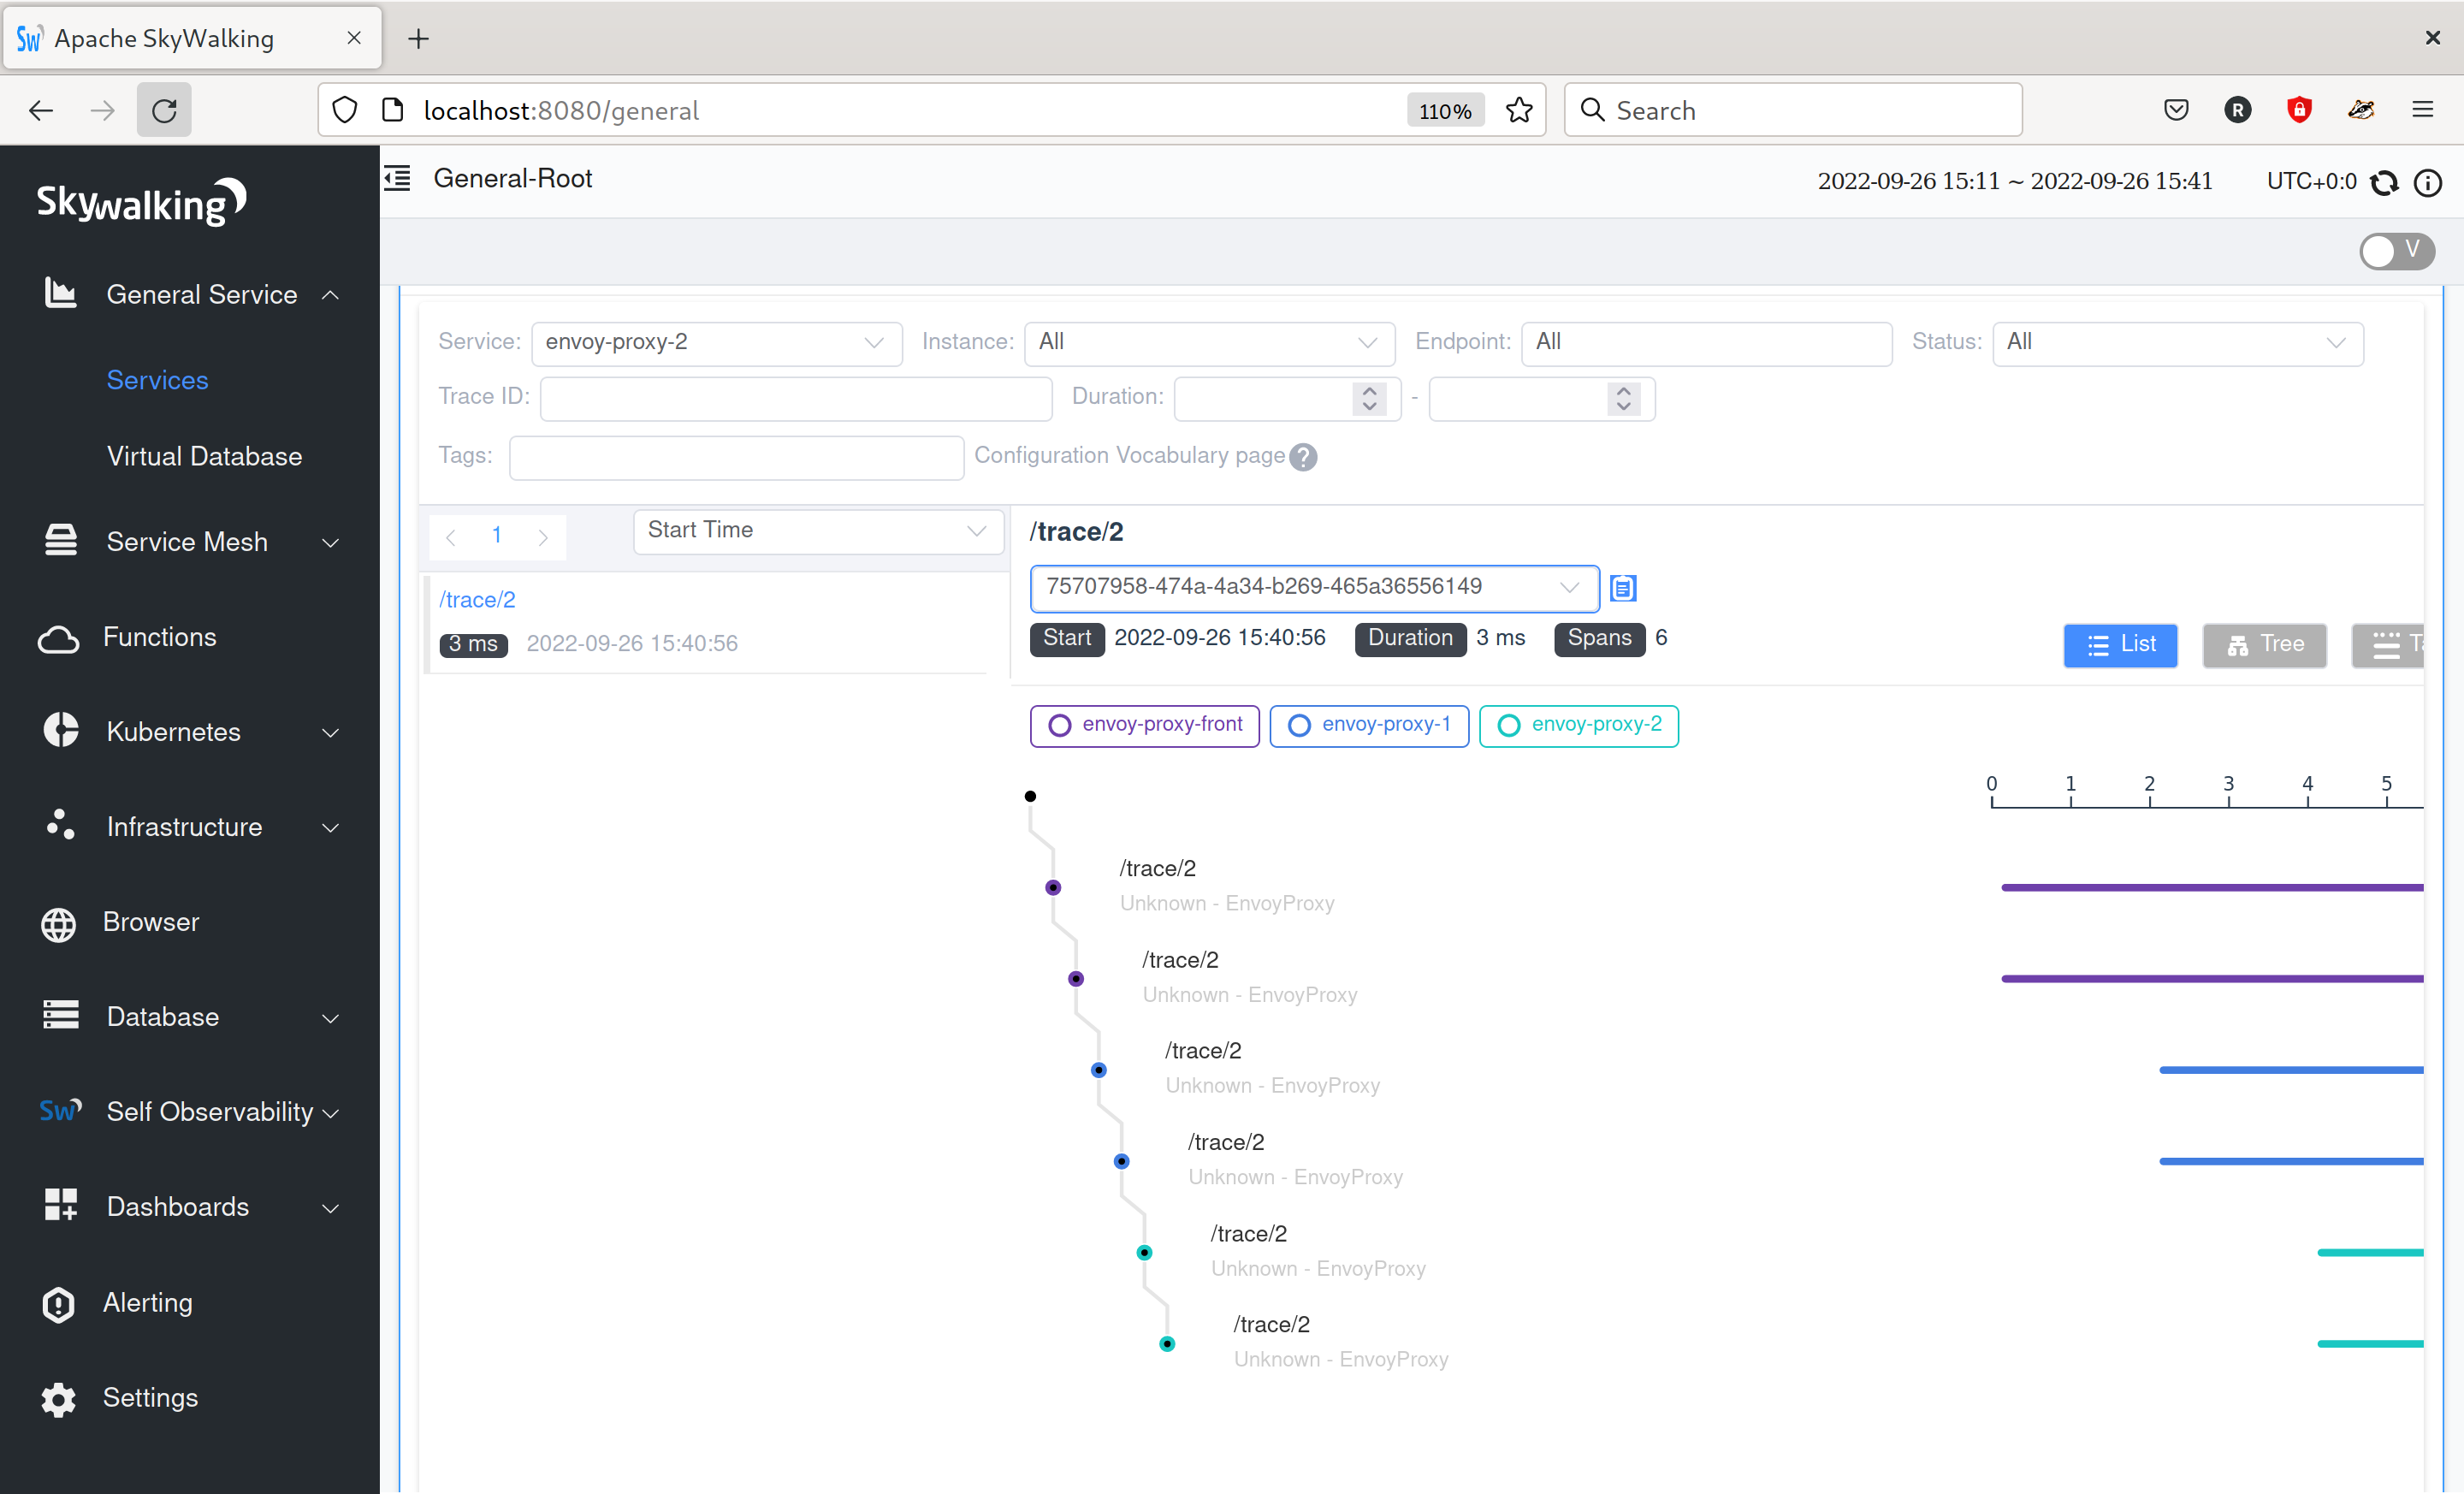
You can also view tracing information for the requests that you made:
See also
- Request tracing
Learn more about using Envoy’s request tracing.
- Envoy admin quick start guide
Quick start guide to the Envoy admin interface.
- Apache SkyWalking
SkyWalking observability analysis platform and application performance management system.