Zipkin tracing
The Zipkin tracing sandbox demonstrates Envoy’s request tracing capabilities using Zipkin as the tracing provider.
In this example, 2 backend services are provided:
service-1service-2
3 Envoy proxies are also provided to route requests to them:
envoy-front-proxy(envoy-front-proxy.yaml)envoy-1(envoy-1.yaml)envoy-2(envoy-2.yaml)
Of these services, only the Envoy front-proxy service is exposed outside of the
composition, on port 10000.
For service-1, requests are routed based on the request path trace/1, as follows:
User -> Envoy(
envoy-front-proxy) -> Envoy(envoy-1) ->service-1
For service-2, requests are routed based on the request path trace/2 as follows:
User -> Envoy(
envoy-front-proxy) -> Envoy(envoy-1) -> Envoy(envoy-2) ->service-2
All Envoy proxies are configured to collect request traces, as can be seen in their configurations, propagating the spans (parent/child/shared context) generated by the Zipkin tracer to a Zipkin cluster.
Each span records the latency of upstream API calls as well as information needed to correlate the span with other related spans (e.g., the trace ID).
The Zipkin collector provides a web UI for viewing the collected traces on port 9411.
Step 1: Build the sandbox
Change directory to examples/zipkin in the Envoy repository.
To build this sandbox example, and start the example services run the following commands:
$ pwd
envoy/examples/zipkin
$ docker-compose pull
$ docker-compose up --build -d
$ docker-compose ps

            Name                          Command             State            Ports
-----------------------------------------------------------------------------------------------------------
zipkin_envoy-1_1             /docker-entrypoint.sh /usr ... Up             10000/tcp
zipkin_envoy-2_1             /docker-entrypoint.sh /usr ... Up             10000/tcp
zipkin_envoy-front-proxy_1   /docker-entrypoint.sh /usr ... Up             0.0.0.0:10000->10000/tcp
zipkin_service-1_1           python3 /code/service.py       Up (healthy)
zipkin_service-2_1           python3 /code/service.py       Up (healthy)
zipkin_zipkin_1              start-zipkin                   Up (healthy)   9410/tcp, 0.0.0.0:9411->9411/tcp
Step 2: Make a request to service-1
Now send a request to service-1, by calling http://localhost:10000/trace/1.
This will be routed via 2 of the Envoy proxies:
front-proxyenvoy-1
$ curl localhost:10000/trace/1
Hello from behind Envoy (service 1)!
Step 3: Make a request to service-2
Now send a request to service-2, by calling http://localhost:10000/trace/2.
This will be routed via all 3 of the Envoy proxies:
front-proxyenvoy-1envoy-2
$ curl localhost:10000/trace/2
Hello from behind Envoy (service 2)!
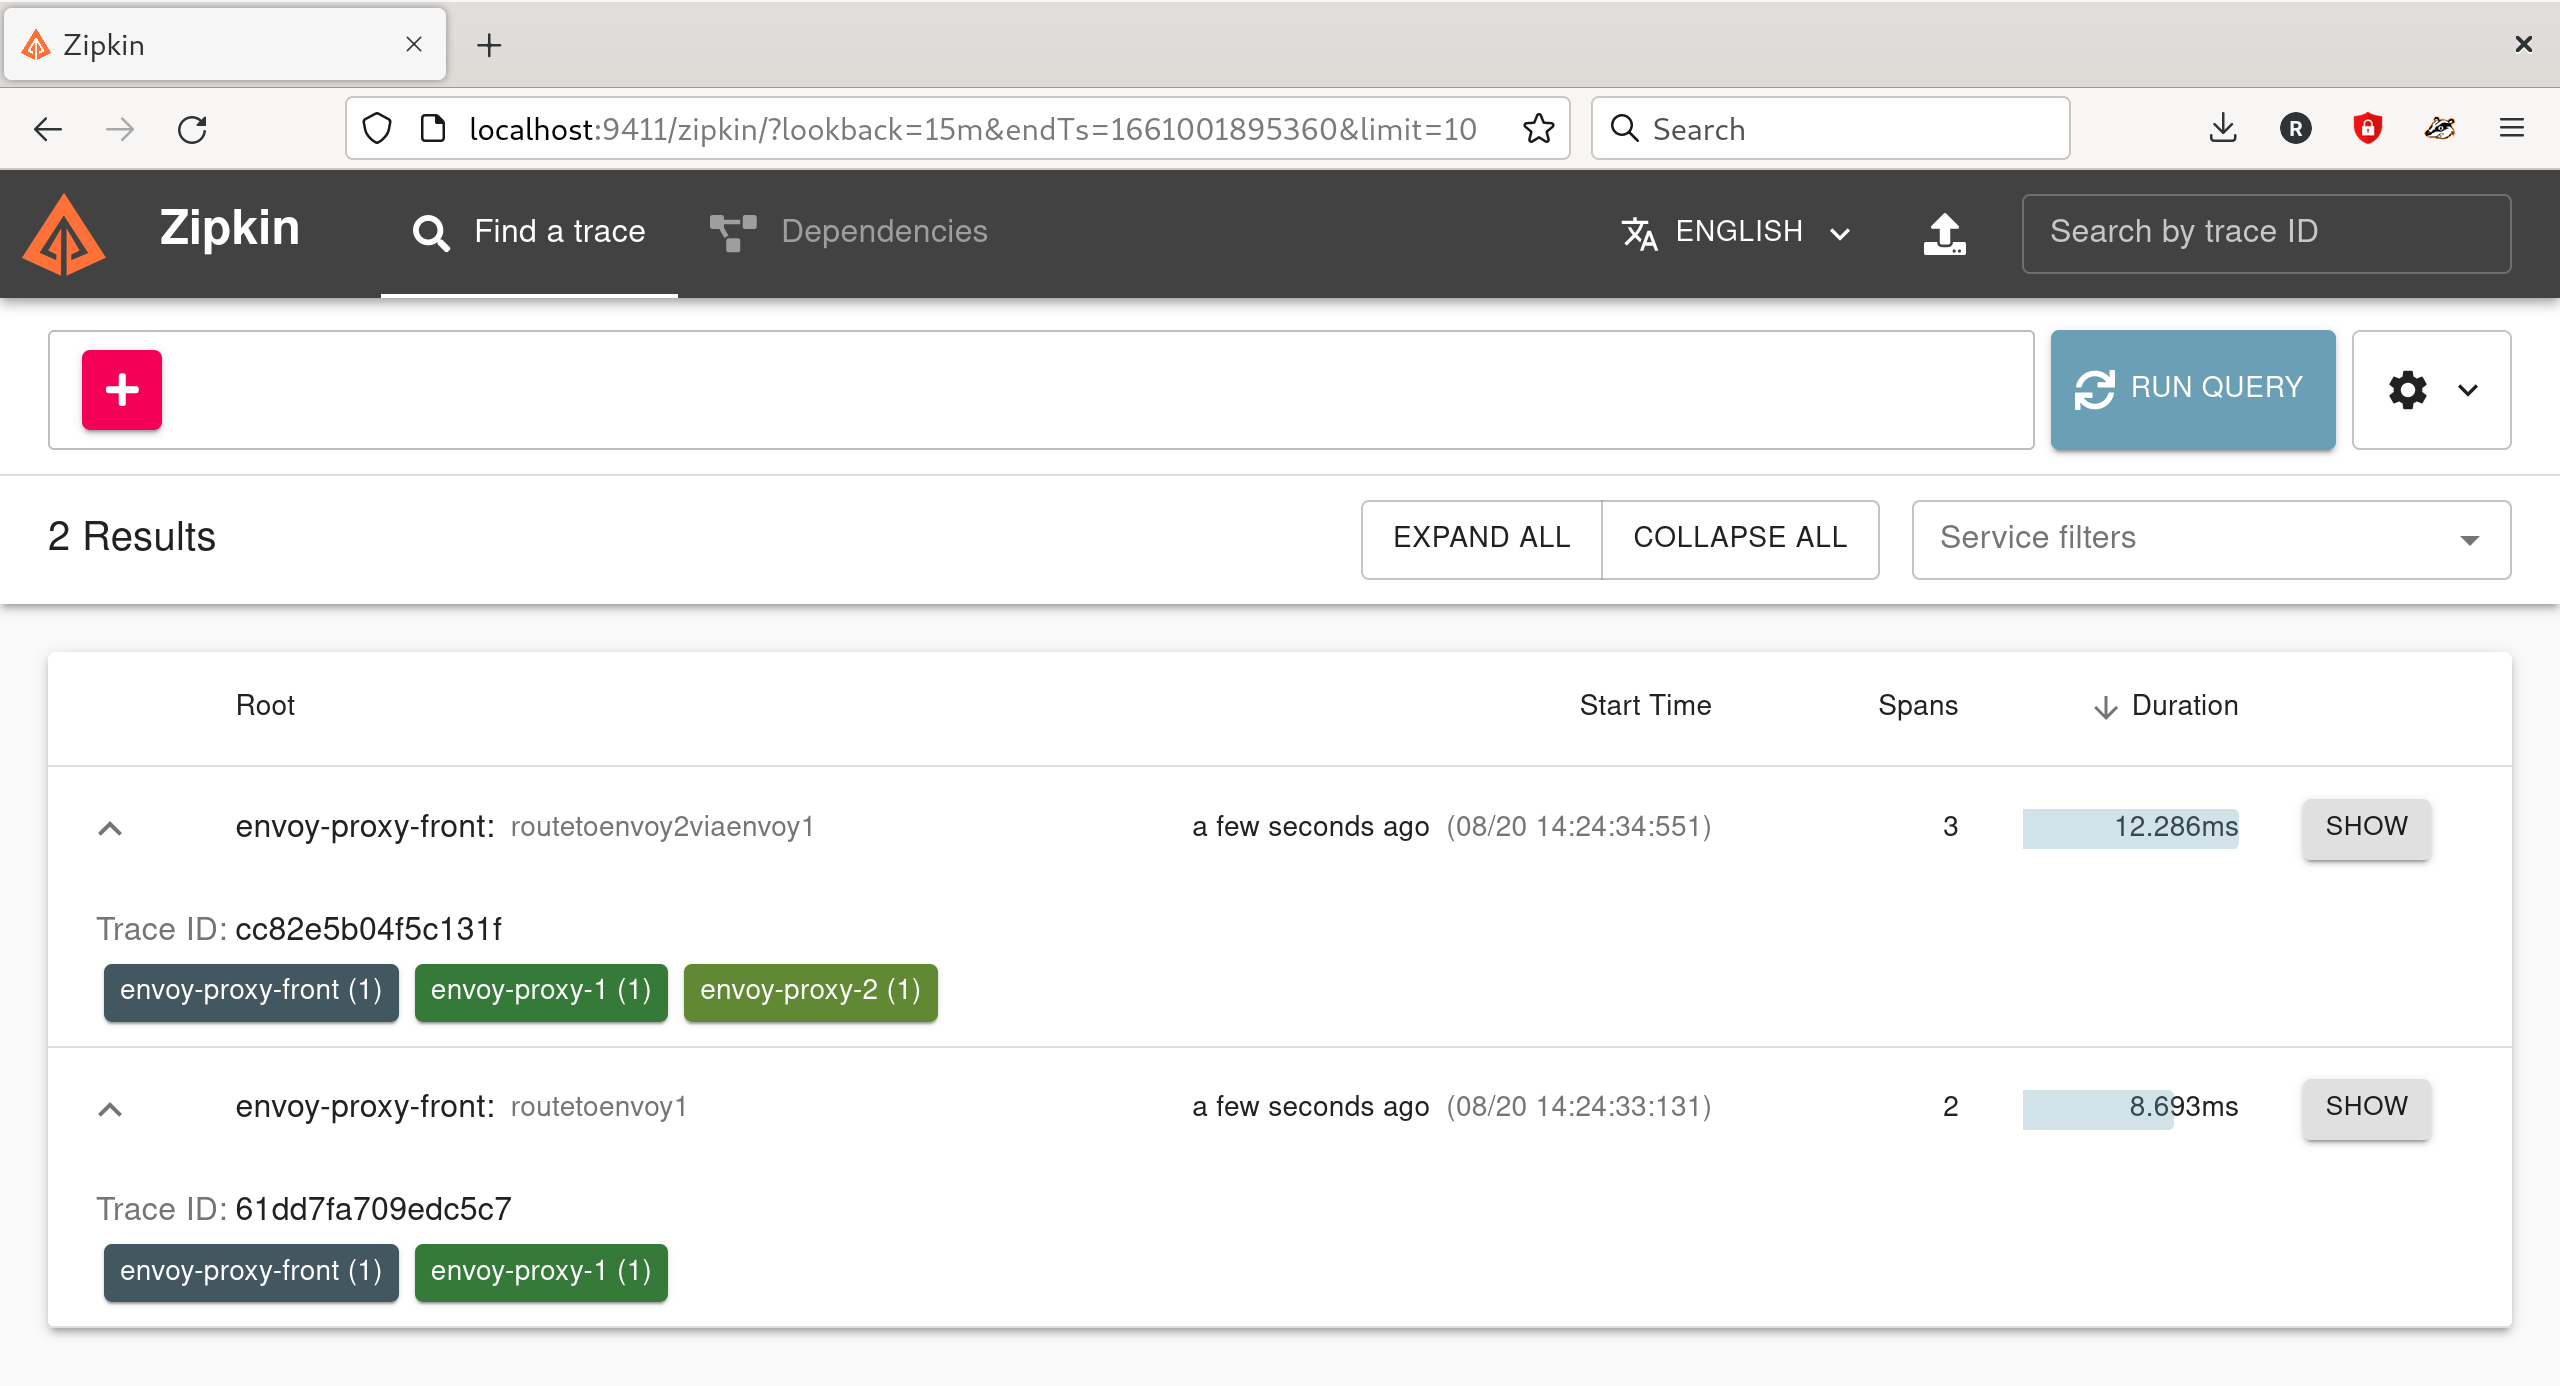
Step 4: View the traces in Zipkin UI
Point your browser to http://localhost:9411 .
You should see the Zipkin dashboard.
Click the RUN QUERY button, and expand the traces by clicking EXPAND ALL.
Here you can explore the paths taken by the requests, as well as the latency incurred at each hop, and other contextual information.
Note that Zipkin identifies the Envoy proxies by the name provided in the bootstrap node/cluster configuration.
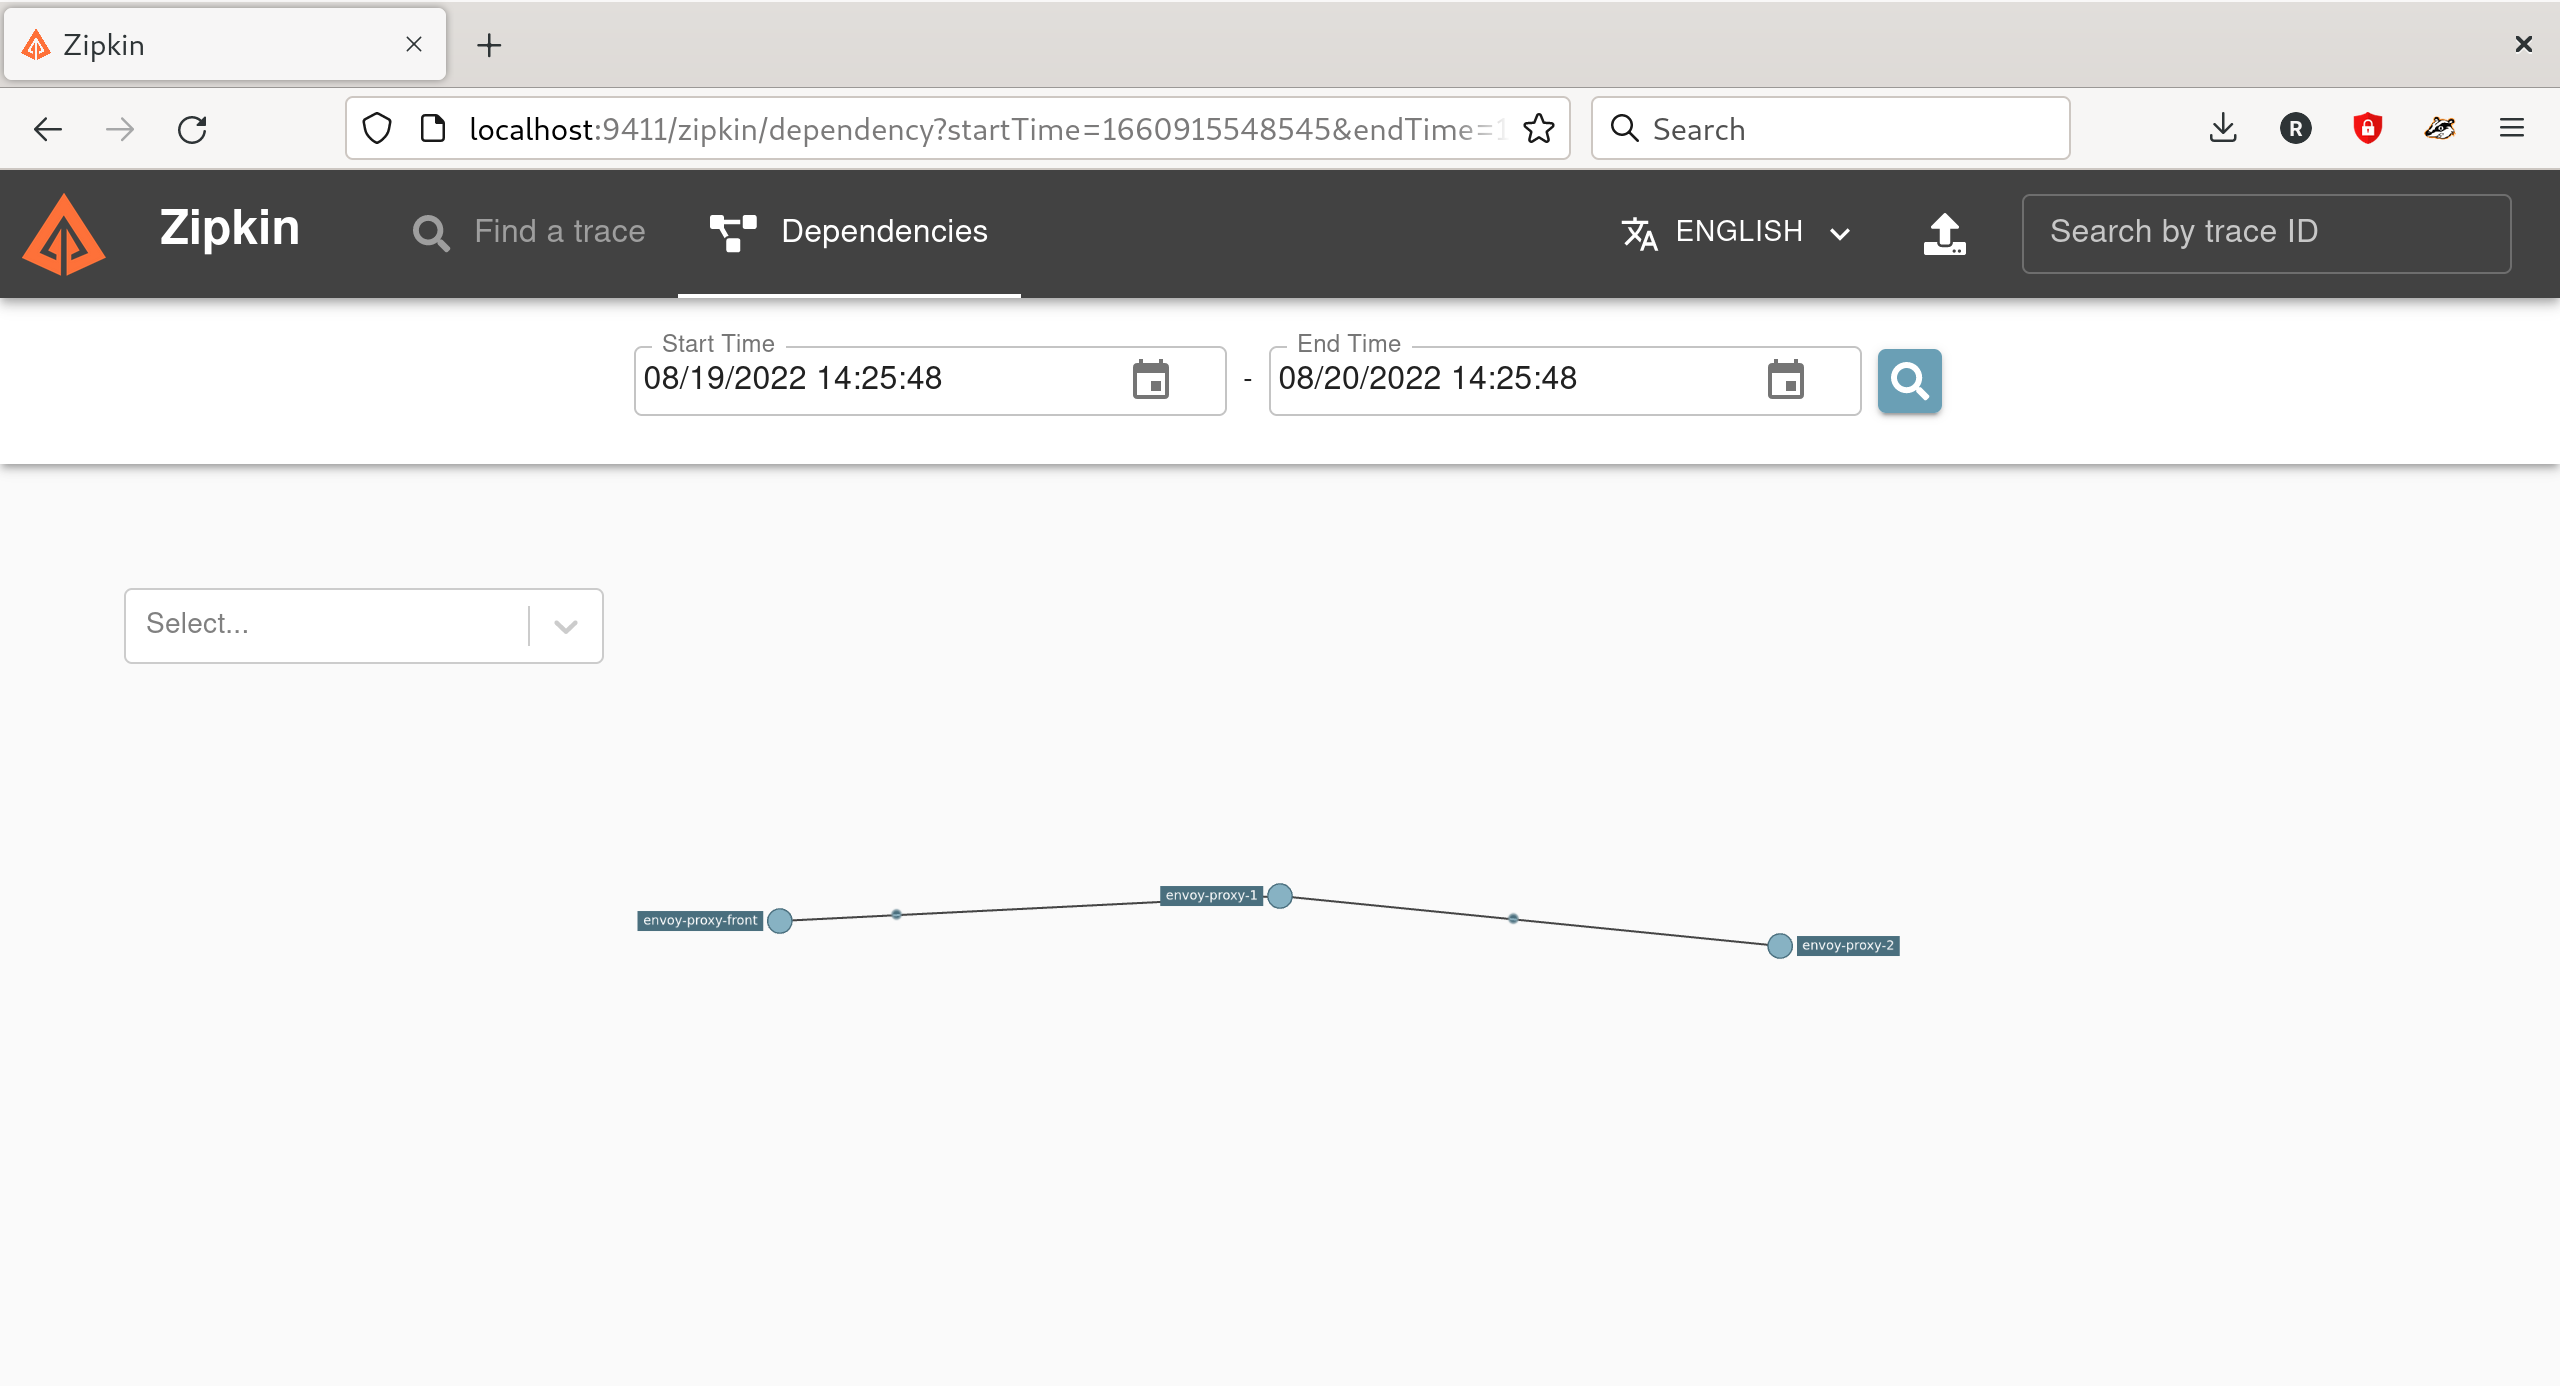
You can also explore the Zipkin dependency UI to view relationships between nodes and the path of traces.
See also
- Request tracing
Learn more about using Envoy’s request tracing.
- Zipkin
Zipkin tracing website.